Peraspera

We specialise in data analytics

We are a team of actuaries, economists, data scientists and agroclimate researchers with a passion for data. Contact us at: info@peraspera.co.uk.

Here are some of our recent data blogs

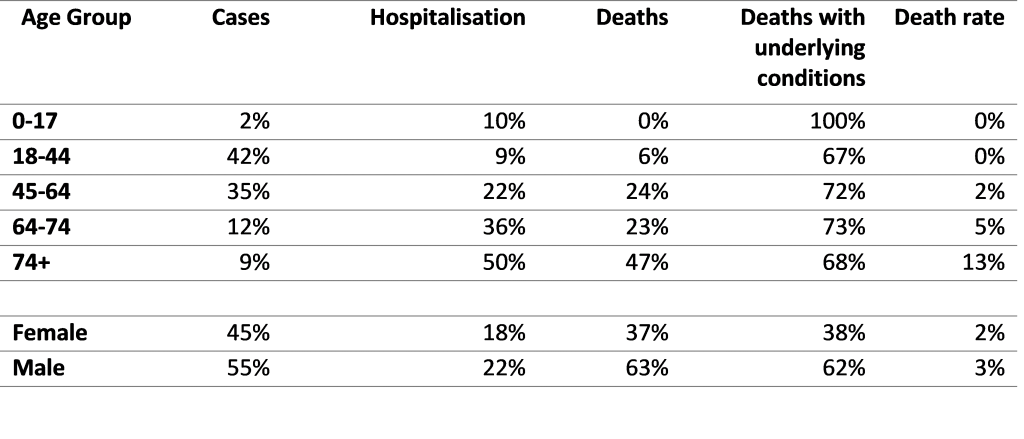
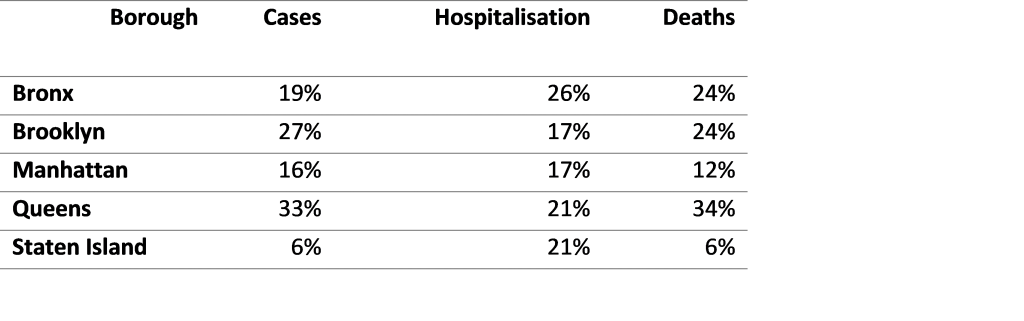
The New Global Industrial Order

The data and analytics used in this article is provided by Peraspera, a firm specialising in data collection and analysis

The Fortune Global 500 firms are the world largest Multinational Enterprises by revenue. Out of a total population of some 55,000 MNEs, these 500 firms dominate the global business landscape in foreign direct investment (FDI) and international trade; they account for approximately 90% of all FDI and over 50% of all international trade globally. The overwhelming lions-share of cross-border economic activity are conducted by and within Fortune Global 500 MNEs.  

Given the sheer global scale of Fortune Global 500 MNEs, we should take these firms more seriously. First, they are pre-eminent drivers of globalisation whose influence will likely expand (exponentially at times) rather than diminish. Second, Fortune Global 500 MNEs, possess the largest and most extensive international operations, and their practice of successful global strategies and performance will be widely relevant across industries and geographies. Third, and importantly, the make-up of this important group of firms will determine the future power bases of the global economy and globalisation.

In this briefing, we explore the top 10 Fortune Global 500 MNEs over the period 2001-2019, and develop an emergent theme in the new global industrial order. Primarily, Asian firms now dominate the top 10 Global Fortune 500 List. There are now more Asian than US firms in the top 10, with Chinese firms now the largest national group. Big Oil is now more dominant while auto manufacturers have lost considerable ground.

Jostling for Position at the Top

Let’s look at the top 10 companies in the world in 2001 based on total revenue.

Rank 2001CompanyRegionIndustry
1Exxon Mobil CorporationUSOil
2Wal-Mart Stores, Inc.USDiversified Retail
3General Motors CorporationUSAuto manufacturer
4Ford Motor CompanyUSAuto manufacturer
5DaimlerChrysler AGGermanyAuto manufacturer
6Royal Dutch/Shell GroupDutch/UKOil
7BPUKOil
8General Electric CompanyUSDiversified Industrial
9Mitsubishi CorporationJapanAuto manufacturer
10Toyota Motor CorporationJapanAuto manufacturer
Data Source: Fortune Global 500

Here are some interesting facts about these top companies in 2001:

  • 5 US firms in top 10.
  • 8 Western firms in top 10 in 2001; 2 non-Western (Toyota and Mitsubishi).
  • No Chinese firms in the top 10
  • 3 oil firms out of top 10
  • 5 auto manufacturers (2 US; 1 EU; 2 Asian)
  • General Electric and Walmart outsiders as diversified industrial and retail respectively.

Now let’s look at the top 10 companies in the world in 2019

Rank 2019CompanyRegionIndustry
1Wal-Mart Stores, Inc.USDiversified Retail
2Sinopec GroupChinaOil
3Royal Dutch/Shell GroupDutch/UKOil
4China National PetroleumChinaOil
5State GridChinaUtility
6Saudi AramcoSaudiOil
7BPUKOil
8Exxon Mobil CorporationUSOil
9Volkswagen AGGermanyAuto manufacturer
10Toyota Motor CorporationJapanAuto manufacturer
Data Source: Fortune Global 500

Here are some interesting facts about these top companies in 2019:

  • Only 2 of the top 10 are US (compared to 5 in 2001)
  • 3 Chinese firms in top 10 (compared to none in 2001)
  • 5 Western firms in top 10 in 2019. (compared to 8 in 2001).
  • 6 of top 10 are oil (compared to 3 in 2001)
  • Only 2 auto (VW and Toyota) no US autos in top 10 (compared to 5 in 2001)
  • Walmart has consistently been top 3 (placed no 1 in 13 out of the last 19 years)

So what’s happened since 2001 ?

1. China has established itself at the top

The data shows that in the first two decades of this century, China has significantly reduced US dominance. Chinese growth over this period has been astonishing given that there was no Chinese firm even in the top 50 in 2001.

2. Auto manufacturers have lost ground

Big Oil has become more dominant over this period while auto manufacturers have lost considerable ground. Only Toyota has managed to retain its position in the top 10 even as Mitsubishi, the other top-ranked Japanese auto manufacturer has lost more than 100 places over this period. The US auto manufacturers have also suffered considerably during this period. Here’s a look at how swiftly auto manufacturers have lost ground over this period.

Company2001-rank2019-rank
General Motors Corporation332
Ford Motor Company430
DaimlerChrysler AG518
General Electric Company848
Mitsubishi Corporation9100+
Data Source: Fortune Global 500

3. Walmart still at the top, but General Electric fades

Walmart as an outsider has done very well during this period and improved its already stellar ranking. However General Electric the other outsider has not managed to do very well and is now a shadow of its former self.

 9,743 total views

Data shows that COVID-19 is more lethal than the flu and why we need to avoid a second wave

As at 22nd April 2020 there were more than 2.5 million COVID-19 cases worldwide with more than 170,000 deaths according to John Hopkins University. A recent study estimated that an average of 389,000 respiratory deaths were associated with influenza (‘flu’) globally each year.

In comparison the UK COVID-19 cases as at 22nd April were 129,044 with  17,377 (hospital) deaths.  So how do these coronavirus deaths compare with the estimated flu deaths?

Weekly all death data

Let’s  start by taking a look at the total weekly deaths (due to all causes) in England & Wales (E&W). Each dot on the chart represents the weekly death total in E&W from 2004-2019. One average there are about 10,000 deaths each week in E&W. However, there are more deaths in the winter than in the summer weeks. In fact, the weekly winter deaths can be up to 4000 more than than than the average in some years.

Data source: ONS

According to the ONS, the provisional number of deaths (including hospital and those outside hospital) registered in E&W in the week ending 10 April 2020 (week 15) was 18,516. This is much higher than the flu death peak in week 2 of 2015 in the chart when there were 14,612 deaths in E&W.

Estimating the flu deaths

According to the WHO, the flu is a respiratory disease caused by a viral infection that affects the lungs and airways. The flu occurs most often in winter in the UK and peaks between January and March.

Guided by these two indicators we use the data for excess winter (respiratory) deaths in E&W to estimate the impact of the flu from 1991-2019. Each white dot in the chart represents the total flu deaths for the year. There were 9,500 flu deaths during 2018/19 and 17,340 deaths during 2017/18. Significantly, estimated flu deaths have started trending upwards recently. They previously peaked at about 25,000 in 1999/2000.

Data source: ONS

Flu risk factors

The analysis further shows that every 3 in 4 flu deaths are for those over 74. Unlike coronavirus, the flu appears to be less deadly for young people. The data further shows that males have a higher risk exposure to the flu up to the age of 84, however beyond this age females have a higher risk exposure.

Data source: ONS

So what does this all mean?

Research suggests that COVID-19 is more than twice as contagious as the flu. Each person with coronavirus can potentially infect between 2-4 people in the absence of social distancing. The high transmission rate means that there is always a chance of a second coronavirus when the social distancing measures are relaxed.

It is not clear how much of an overlap there is in the current coronavirus and flu deaths. However, if a second wave of coronavirus (without a vaccine) coincides with the flu this winter the outcome could be catastrophic particularly if the flu becomes more severe this winter in line with it’s worsening trend. This is something policymakers need to plan for in advance.

 8,447 total views

An analysis of the UK COVID-19 data

UK is now the epicentre of the coronavirus in Europe as the virus deaths begin to peak and hopefully plateau. As of  17thApril 2020 the total COVID-19 cases in the UK were 114, 217 with the total COVID-19 hospital deaths numbering 15,464 – this represents a crude death rate of 14% in the UK which is disturbingly high.

UK COVID-19 heat map

Let’s take a closer look at a UK COVID-19 heat map. The heat map shows total deaths across the UK as at 17th April 2020. The darker the red colour the higher the number of deaths (as a proportion of the population). London has the darkest hue of red in the heat map because this is where the virus has caused the most damage. Outside London the Midlands have the highest virus-related deaths.

Data Source: UK Public health and the NHS

Let’s take a look at how the virus cases have spread across the UK over the last 4 weeks. London has the highest number of cases in the UK, however the proportion of cases in London has come down steadily from 38% to 21% over the last 4 weeks. The North West is the next potential hot spot with the highest increase in the cases over the last 4 weeks – it has now overtaken the South East.

Data Source: UK Public health and the NHS

UK COVID-19 risk factors

Let’s take a closer look at the age-wise COVID-19 impact data for England. The data shows that 40% of the deaths are for the 60-79 age group while 52% of the deaths are for the 80+ age group. Unpredictably, the 40-59 age group in England appears to be doing better in comparison with Italy and New York.

Age groupProportion of deaths
0 – 19 yrs0%
20 – 391%
40 – 598%
60 – 7940%
80+52%

Data Source: UK Public health and the NHS

As seen in other countries, the ONS data shows that males in the UK are significantly more at risk than females with a death rate which is almost double that of females. This is very similar to the experience in Spain (7% versus 4%).

Deaths involving COVID-19
Male113.1
Female54.1
Age-standardised mortality rates for deaths involving and due to COVID-19, per 100,000 population, England and Wales, deaths occurring in March 2020
Data Source: ONS

 9,788 total views

New York City COVID-19 death rate doubles in two weeks

As of 12th April 2020 the total COVID-19 cases in US were 557,590 while the total COVID-19 deaths numbered 22,109.  The US now has more COVID-19 deaths than any country. New York is the current hotspot in the US and had 40% of the total cases as at 29th March 2020. Two weeks on and New York now has 33% of the total US cases. This means that the virus is spreading more widely across the US.  

So, let’s take a closer look at a US COVID-19 heat map to see how the virus is spreading in the US. The heat map shows the ‘incidence’ (measured here as cases as a proportion of total state population) and deaths across the US as at the end of 12th April 2020. The darker the red colour the higher the virus incidence in the state; the larger the black dot the higher the number of deaths. There is an obvious cluster around New York. Further away Louisiana, Michigan, Washington, and Illinois are now taking on a darker hue suggesting that these might emerge as the next hotspots.

Source: State and county health departments

Let’s take a closer look at the COVID-19 related data for New York City and compare it with the situation two weeks ago on 29th March 2020. The data shows that currently 38% of the cases here are for the 18-44 age group and 36% for the 45-64 age group. This is similar to the data two weeks ago.

Worryingly, the hospitalisation rate is now higher for all age groups from two weeks ago (the numbers in brackets). Frighteningly, the current death rates have doubled over the two weeks – in fact the death rates for the 64+ age group is now almost the same as Italy.

Age GroupCasesHospitalisationDeathsDeaths with underlying conditionsDeath rate
0-172%9% (10%)0%100%0% (0%)
18-4438%11% (9%)5%78%1% (0%)
45-6436%27% (22%)23%84%4% (2%)
64-7413%47% (36%)24%78%12% (5%)
74+11%60% (50%)47%72%26% (13%)
Female46%23% (18%)38%38%5% (2%)
Male54%29% (22%)62%62%7% (3%)

Source: New York City Government

Now let’s look at the impact by boroughs. The hospitalisation rate has increased across all boroughs over the last two weeks (numbers in brackets) and is now close to what it was in the Bronx two weeks ago. The Bronx was ahead of the other boroughs two weeks ago and might be the one to watch going forward.

BoroughCasesHospitalisationDeaths
Bronx22%28% (26%)23%
Brooklyn26%26% (17%)28%
Manhattan13%27% (17%)11%
Queens31%28% (21%)32%
Staten Island8%16% (21%)5%

Source: New York City Government

 10,238 total views

An analysis of the Spanish COVID-19 data

In early spring Italy became the European epicentre of the coronavirus outbreak. Spain has quickly followed Italy. As of  8th April 2020 the total COVID-19 cases in Spain were 152,446 with the total COVID-19 deaths numbering 15,238 – the second highest in the world after Italy.  

Let’s take a closer look at a Spanish COVID-19 heat map. The heat map shows total deaths (as a proportion of the regional population) across Spain as at 8th April 2020. The darker the red colour the higher the number of deaths (as a proportion of the population). Madrid in central Spain, has the darkest hue of red in the heat map because this is where the virus has caused the most damage. Noticeably the heat map shows a cluster around Mardrid similar to the cluster around Lombardia in Italy, however thankfully this cluster looks contained. Significantly the islands such as the Canary Islands in the south have a much paler hue of red showing a lower impact in comparison with central Spain. This is probably due to travel restrictions and social distancing across Spain.

Data Source: Spanish health ministry

Let’s take a closer look at the age-wise Spanish COVID-19 impact data. The data shows that 34% of the cases are for the 40-59 age group with a death rate of 1%. 1 in 3 of the cases in this age group require hospitalisation with only 1% of the cases requiring ICU. 

The 60-79 age group also has high incidence (33% of the total cases) with a high death rate of 6% (this is lower than the 14% death rate seen for this age group on Italy). However 2 in 3 cases in this age group require hospitalisation with 6% requiring ICU.

As expected the 80+ age group is the most at risk of death with a very high death rate (20%) with 20% of the cases requiring ICU. 15% of the cases are for the 20-39 age group (higher than Italy) with 1 in 5 requiring hospitalisation which is also worrying. No one is spared here either.

The New York experience shows that 1 in 5 of all the cases require hospitalisation on average. Worryingly the hospitalisation is almost double that in Spain.

Age groupCasesHospitalisation rateICU admission rateDeath rate
0-191%25%0%0%
20-3915%21%0%0%
40-5934%37%1%1%
60-7933%67%6%6%
80+17%66%20%20%
Females51%40%2%4%
Males49%59%6%7%

Data Source: Spanish health ministry

The Spanish data again shows that males are significantly more at risk than females with a death rate which is almost double that of females (7% verus 4%). Overall the death rate is about 10% in Spain which is disturbingly high and worrying for Europe as a whole given the already high death rate in Italy. As in the case for Italy let us hope this rate moves down quickly as Spain increases its testing.

 7,993 total views

An analysis of the Italian COVID-19 data

In early spring Italy became the European epicentre of the coronavirus outbreak. As of  5th April 2020 the total COVID-19 cases in Italy were 132,547 while the total COVID-19 deaths numbered 16,523 – the highest in the world.  

Let’s take a closer look at the Italian COVID-19 heat map. The heat map shows total deaths across Italy as at 5th April 2020. The darker the red colour the higher the number of deaths. Lombardia in north Italy has the darkest hue of red in the heat map because this is where the virus has caused the most damage in Italy. Noticeably the heat map shows a cluster around Lombardia, however thankfully this cluster is restricted to just the adjacent regions where the red hue here is also much lighter. This containment is probably due to strict social distancing across Italy.

Let’s take a closer look at the age wise Italian COVID-19 impact data. The data shows that 33% of the cases are for the 40-59 age group with a low death rate of 1%. The 60-79 age group has a high incidence (36% of the total) with a disturbingly high death rate (14%). As expected the 80+ age group is the most at risk of death with an alarming  death rate (28%). 11% of the cases are for the 20-39 age group. No one is spared.

The Italian data shows that males are significantly more at risk than females with a death rate which is almost double that of females (13% versus 7%). This is very different from the  New York experience and needs further investigation.

Age groupCasesDeathsDeath rate
0-191%0%0%
20-3911%0%0%
40-5933%5%1%
60-7936%46%14%
80+19%49%28%
Females44%31%7%
Males56%69%13%
Source: Italian regional government departments

A key factor is all of this is the proportion of cases requiring hospitalisation. This sizes up the true impact on the health services. The New York experience shows that 1 in 5 of all the cases require hospitalisation on average. The Italian data shows that 3% of the confirmed cases required admission to ICU.

Looking further at the Italian testing data shows that nearly 1 in 3 of the tests were positive, showing just how quickly the virus transmitted in the top 5 impacted Italian regions. On average across Italy 1 in every 5 tests proved positive.

Region (worst impacted)% of positive tests% of cases in ICUDeath rate
Lombardia34%3%18%
Emilia-Romagna24%2%12%
Piemonte32%4%9%
Veneto8%3%6%
Marche29%3%13%
Overall in Italy19%3%12%
Source: Italian regional government departments

The Italian death rate at 12% is calamitous. This is driven up by the high death rate in the 60+ age group. Let’s hope this moves down quickly as Italy ramps up it’s testing.

 10,618 total views

What can the rest of the world learn from the COVID-19 impact data from New York ?

Coronavirus has now spread to nearly every state and territory. As of  31st March 2020 the total COVID-19 cases in the US were 185,499 while the total COVID-19 deaths numbered 3,834.

Let’s take a closer look at a US COVID-19 heat map. The heat map shows the ‘incidence’ (measured here as cases as a proportion of total state population) and deaths across the US as at the end of 31st March 2020. The darker the red colour the higher the virus incidence in the state; the larger the black dot the higher the number of deaths. New York stands out with the highest incidence (41%) as well as the highest number of deaths (41%) in the US.

Source: State and county health departments

Let’s take a closer look at the COVID-19 related data for New York. The data shows that 42% of the cases here are for the 18-44 age group – the young are therefore not immune to this virus even though the death rate is almost close to zero at the moment for this age group.

The 45-64 age group is also showing a disturbingly high incidence (35% of the total) and death rate (2%). As expected the 74+ age group is the most at risk of death with an alarming death rate (13%). Males appear to be more at risk than females but this might be due to co-factors that need further investigation.

A key factor in all of this is the proportion of cases requiring hospitalisation. This sizes up the true impact on health services. 1 in 5 of all the cases requires hospitalisation on average. Ominously, 1 in 10 of the cases less than 45 years of age require hospitalisation. The hospitalisation rate goes up with age as expected

Source: New York City Government

Now let’s look at the impact of boroughs. The incidence is highest in Queens and Brooklyn. The proportion of deaths in the Bronx is higher relative to the proportion of cases there. This suggests that the death rate is higher for the Bronx area. The proportion of cases requiring hospitalisation is also highest for the Brooklyn area.

Source: New York City Government

Coronavirus does not respect boundaries. The major metropolitan cities around the world who still have time should use this to prepare for what might be coming their way.

 9,438 total views

US corn production Iowa – part 2

The second part of the blog series looks at the historical Iowa corn planted area from 1926 to 2015. Iowa is one of the most important corn producing states in the US. Hence it is important to understand the historical corn trends in Iowa if we want to make future predictions

The bubble chart shows two very significant trends in the corn planting history of Iowa:

  1. southern Iowa districts have a reduced share relative to the other states
  2. northeast Iowa district share has increased significantly

This is the overall US trend witnessed in part 1 of this blog series. Given this history should we expect that corn planting in Iowa will shift further northeast? The data seems to suggest we should.

The data comes from USDA/NASS again.


 9,896 total views

US corn production – Part 1

I am currently researching the impact of weather on corn production in the US. This blog aims to show case some of the interesting results I have found along the way.

Part 1 of this series of discusses how the US corn harvesting area has shifted over time from 1866 – 2015. The data is available from the USDA NASS Quickstats website. The data has been illustrated displayed using the bubble charts introduced by Hans Rosling in his TED 2006 lecture.

So US corn production has gradually moved northwards from the US south to the US midwest from 1866-2016. Here is another chart displaying this using a spatial map of the US.

This shift north coincides with the gradual warming of the US south over the same period (1896-2000) – click on the chart below which has been produced using annual mean temperature from the PRISM dataset).

The shift in corn production probably happened due to a number of agronomic and economic factors including the warming of the south. The question is how much of this shift north is attributable to the climate change in the south.

If this shift was indeed due to the gradual warming in the south then as temperatures rise across the northern hemisphere (as predicted under the current climate change scenarios) we should witness US corn production shifting further north perhaps at a faster pace than before. This phenomenon will have a significant impact on global food security given the importance of US in global corn production.

Furthermore, this shift to cooler areas is likely to occur globally especially for rainfed agriculture. This shift is likely to pose a significant challenge for governments and policy-makers around the world and there is an urgent need to prepare for it now.

 8,543 total views